Telemetry and data collection
Percona has two kinds of telemetry for Percona Server for MySQL:
-
Installation-time telemetry — runs once at install or container startup.
-
Continuous telemetry — a DB component and a host agent that collect and send metrics on a schedule.
You control whether to share telemetry data. The program is optional: you can disable either or both systems if you do not want to share anonymous data.
Percona does not gather personal information. All collected data is anonymous and cannot be used to identify individual users or servers. Details: Percona Privacy policy .
Telemetry is included in Percona software packages, compressed archives (tarballs), and Docker images. Continuous telemetry from tarballs needs the telemetry agent and a writable telemetry directory.
Why telemetry matters
Telemetry helps Percona see how the software is used, spot bugs and performance issues early, and prioritize fixes and features. In turn, users benefit from faster fixes, more relevant improvements, and a more stable product over time.
Installation-time telemetry
Installation-time telemetry runs only once during software installation or Docker container startup. Installation-time telemetry collects system configuration, hardware, software version, and environment details during installation or container startup, then does not run again.
Installation-time telemetry file example
[{"id" : "c416c3ee-48cd-471c-9733-37c2886f8231",
"product_family" : "PRODUCT_FAMILY_PS",
"instanceId" : "6aef422e-56a7-4530-af9d-94cc02198343",
"createTime" : "2026-03-26T15:43:18Z",
"metrics":
[{"key" : "deployment","value" : "PACKAGE"},
{"key" : "pillar_version","value" : "8.4.8-8"},
{"key" : "OS","value" : "Oracle Linux Server 9"},
{"key" : "hardware_arch","value" : "x86_64 x86_64"}]}]
Disable installation-time telemetry
Installation-time telemetry is enabled by default. To disable installation-time telemetry, set PERCONA_TELEMETRY_DISABLE=1 for the root user or in the environment before installing. Disabling installation-time telemetry does not turn off continuous telemetry.
sudo PERCONA_TELEMETRY_DISABLE=1 apt install percona-server-server
sudo PERCONA_TELEMETRY_DISABLE=1 dnf install percona-server-server
docker run -d -e MYSQL_ROOT_PASSWORD=test1234# -e PERCONA_TELEMETRY_DISABLE=1 --name=percona-server percona/percona-server:8.4
Continuous telemetry
Continuous telemetry uses a telemetry agent and a database component. Continuous telemetry collects information and sends the data daily (after an initial period).
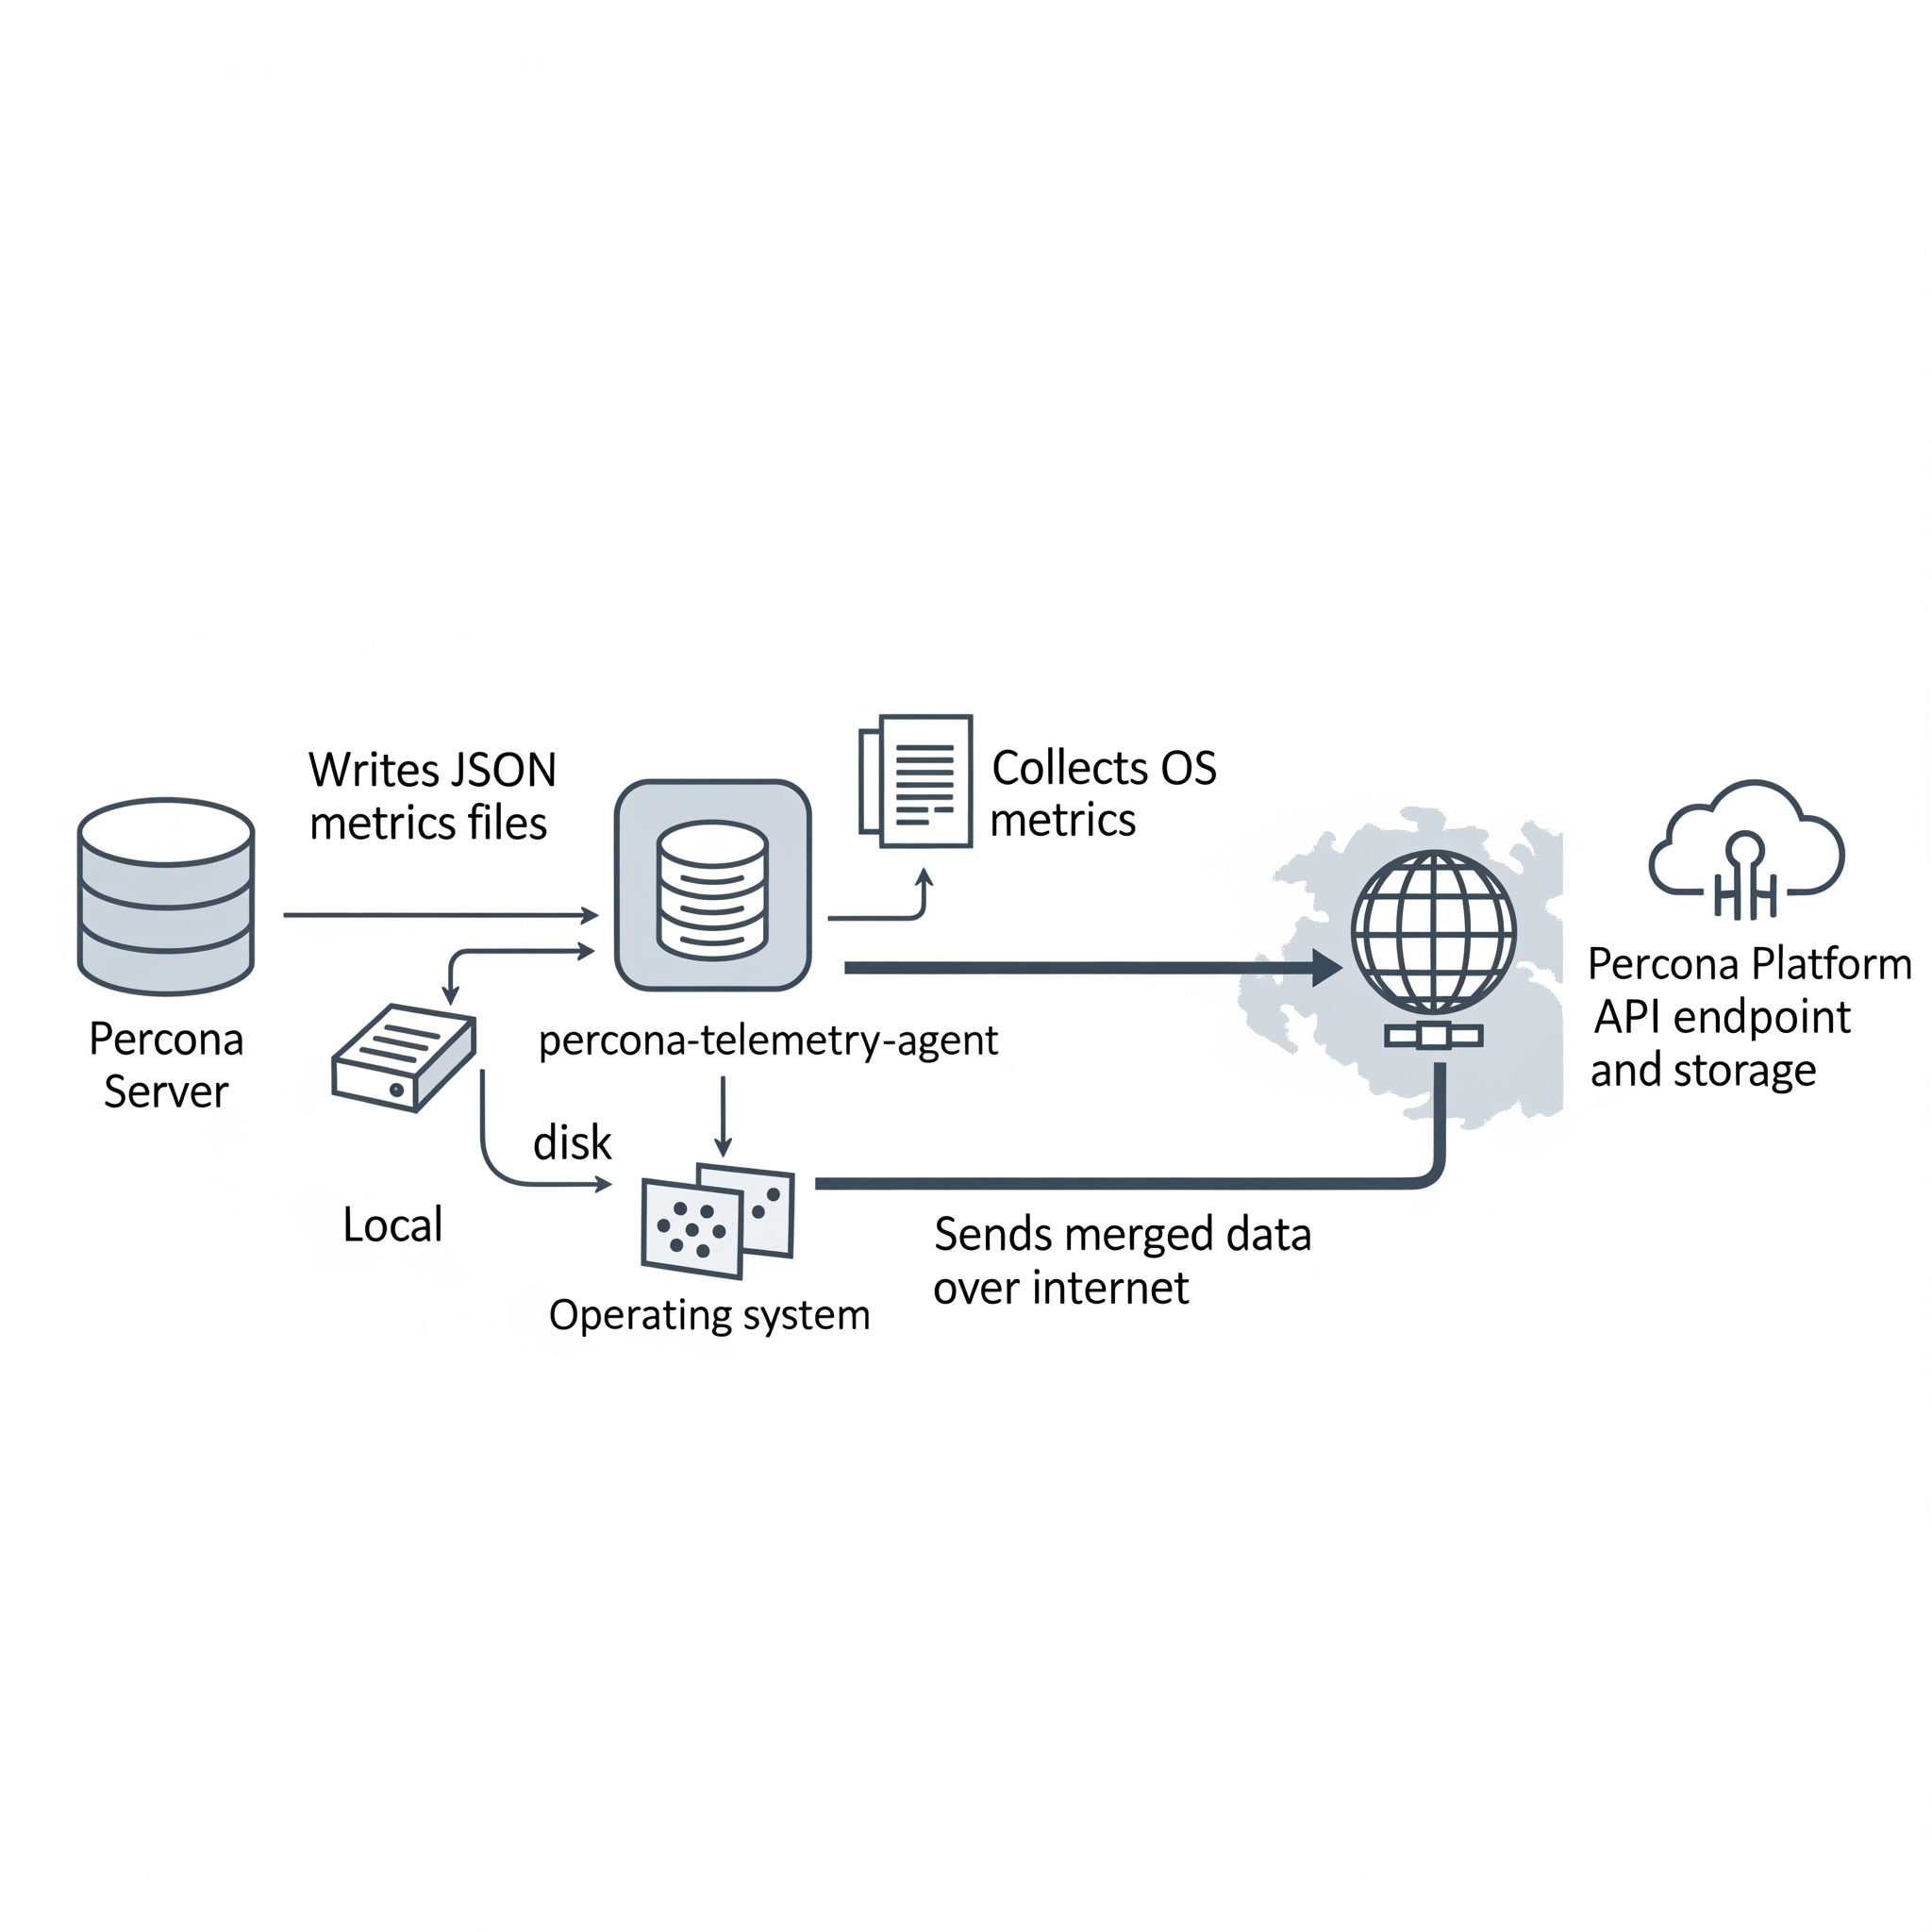
Elements of the continuous telemetry system
| Piece | Role |
|---|---|
| Percona Telemetry DB component | Collects metrics inside the server and writes them to a metrics file on disk. |
| Metrics file | JSON file on the host filesystem holding collected metrics. |
Telemetry agent (percona-telemetry-agent) |
OS-level process: collects OS metrics, reads the metrics file, merges data, sends to Percona Platform, and records installed Percona packages via the local package manager. |
On the Percona Platform side:
| Piece | Role |
|---|---|
| Telemetry Service | API endpoint that receives telemetry and stores the payloads. |
| Telemetry Storage | Long-term storage for telemetry data. |
Overview of the DB component
Percona Server for MySQL installs a DB component by default (source integration or modular component_percona_telemetry).
The DB component:
-
Collects database metrics daily
-
Writes a new timestamped
.jsonfile under the telemetry directory -
Keeps roughly one week of metrics files (older files are removed before creating new ones)
The DB component does not collect:
-
Database names
-
User names or credentials
-
Application or user data
Locations of metrics files and telemetry history
Root for host telemetry: /usr/local/percona/telemetry
Product-specific paths (prepend the root):
| Product | Path |
|---|---|
| Percona Server for MySQL | ${telemetry root}/ps/ |
Percona Server for MongoDB (mongod) |
${telemetry root}/psmdb/ |
Percona Server for MongoDB (mongos) |
${telemetry root}/psmdbs/ |
| Percona XtraDB Cluster | ${telemetry root}/pxc/ |
| PostgreSQL products | ${telemetry root}/pg/ |
Archived copies after successful sends: ${telemetry root}/history/
Metrics file format
Files are JSON. Percona may extend the schema over time. Example (structure as shipped in upstream docs; active_plugins and similar lists may be long in real files):
{
  "db_instance_id": "e83c568c-e140-11ee-8320-7e207666b18a",
  "pillar_version": "8.4.8-8",
  "active_plugins": [
    "binlog",
    "caching_sha2_password",
    "InnoDB",
    "PERFORMANCE_SCHEMA"
  ],
  "active_components": [
    "file://component_percona_telemetry"
  ],
  "uptime": "6185",
  "databases_count": "7",
  "databases_size": "33149",
  "se_engines_in_use": [
    "InnoDB"
  ],
  "replication_info": {
    "is_semisync_source": "1",
    "is_replica": "1"
  }
}
Percona telemetry agent
The percona-telemetry-agent runs on the database host. The agent manages JSON files under the telemetry root path.
- Log file:
/var/log/percona/telemetry-agent.log - First 24 hours: no collection or upload
- After the first 24 hours: attempts to send daily; on failure, retries up to five times
- After a successful send, the agent stores a copy under
history/and deletes the original file produced by the database - If the telemetry directory lacks the expected Percona-related files, nothing is sent
Telemetry agent payload example
{
  "reports": [
    {
      "id": "B5BDC47B-B717-4EF5-AEDF-41A17C9C18BB",
      "createTime": "2026-03-26T15:44:54Z",
      "instanceId": "B5BDC47B-B717-4EF5-AEDF-41A17C9C18BA",
      "productFamily": "PRODUCT_FAMILY_PS",
      "metrics": [
        {
          "key": "OS",
          "value": "Ubuntu"
        },
        {
          "key": "pillar_version",
          "value": "8.4.8-8"
        }
      ]
    }
  ]
}
| Field | Description |
|---|---|
id |
Random UUID v4 for the request |
createTime |
Timestamp |
instanceId |
DB host ID from metrics/telemetry_uuid, or a generated UUID v4 when the host ID is absent |
productFamily |
Derived from file path (e.g. PRODUCT_FAMILY_PS) |
metrics |
Key/value pairs from the metrics file |
OS-level metrics included with checks can include:
| Key | Description |
|---|---|
OS |
Operating system name |
hardware_arch |
CPU architecture |
deployment |
e.g. PACKAGE or DOCKER |
installed_packages |
Installed Percona-related packages (name, version, repository when available) |
Reported package names typically match patterns such as: percona-*, Percona-*, proxysql*, pmm, etcd*, haproxy, patroni, pg*, postgis, wal2json, and similar.
Disable continuous telemetry
Continuous telemetry is enabled by default. To disable continuous telemetry completely, use the following order of operations:
- Add
percona_telemetry_disable=1under[mysqld]inmy.cnf(or your included option file), then restart the server so the setting is active. Add the option and restart before relying onUNINSTALL COMPONENTalone: after a restart, the server can load telemetry again ifpercona_telemetry_disableis not set, even if you had uninstalled the component earlier. - Run
UNINSTALL COMPONENT "file://component_percona_telemetry";so the server stops writing telemetry metrics files. - Stop and disable the
percona-telemetry-agentservice so no data is sent from the host.
Disabling continuous telemetry as described above does not affect installation-time telemetry. To opt out of installation-time telemetry, set PERCONA_TELEMETRY_DISABLE before installing.
Disable the telemetry agent
systemctl stop percona-telemetry-agent
systemctl disable percona-telemetry-agent
Agent dependencies and removal
The telemetry agent is a mandatory dependency of Percona Server for MySQL packages. Removing the agent can remove or break the database package on some systems—check your package manager behavior before removing.
-
DNF: Removing the last package that depended on the agent may remove the agent package.
-
APT: Use
apt autoremovewhere appropriate; APT may not remove the agent automatically when you remove only the server package.
Disable the DB component
Even with the agent stopped, the DB telemetry component can still write metrics files for about seven days until you uninstall the component.
Use UNINSTALL COMPONENT after you have set percona_telemetry_disable=1 and restarted (see the ordered steps above). Uninstalling alone does not guarantee telemetry stays off when the server restarts.
UNINSTALL COMPONENT "file://component_percona_telemetry";
my.cnf should already contain the following from step 1; if percona_telemetry_disable=1 is not present yet, add the line and restart:
[mysqld]
percona_telemetry_disable=1